Vector graphics can be scaled without any loss of quality or accuracy. That can be very helpful for visual representation of data, such as printed reports or complex structures. When I started exploring the PDF format for my recently released example, I quickly discovered that drawing can be almost as easy as adding web links…
Claris FileMaker currently supports two kinds of vector graphics. SVG can be used in button icons and Web Viewer, PDF in layouts and container fields.
If you want to visualize data, such as a CNC program, financial results, mathematical function, or COVID-19 stats, in a way that can be zoomed or interacted with, SVG in Web Viewer can be the best choice. If you want to allow your visualization to be exported or printed, you may want to generate it into a container field as a PDF.
Even though the technical specification of PDF has 746 pages, if all you’re looking for is a way to produce an image consisting of various colored lines and shapes, you can get that done with just a few custom functions from my example.
Download the example right away
Base principles
PDF is based on the PostScript language, created back in the years 1982-1984 to describe pages in a way that could be printed on laser printers and plotters. Just like its origin, PDF is a document consisting of fixed-layout pages. Every page can include text, fonts, vector graphics, raster images and other information needed to display it.
Every PDF page contains objects of various types. The most important types of objects for rendering are content streams and resources. Content streams tells the PDF viewer what to render, where and how. Resources are used for complex things you might want to re-use multiple times, such as fonts or patterns (including gradients).
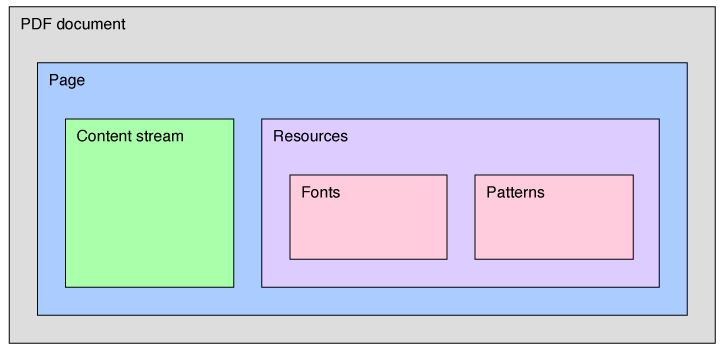
PDF can be quite difficult to parse due to the many things it supports as a format, but creating a valid PDF to render a simple vector image can be relatively easy. My examples just creates a single-page PDF with a single content stream and uses resources for font definitions and patterns. All components are kept in a JSON structure until it needs to be rendered.
The Hitchhiker’s Guide to the Example
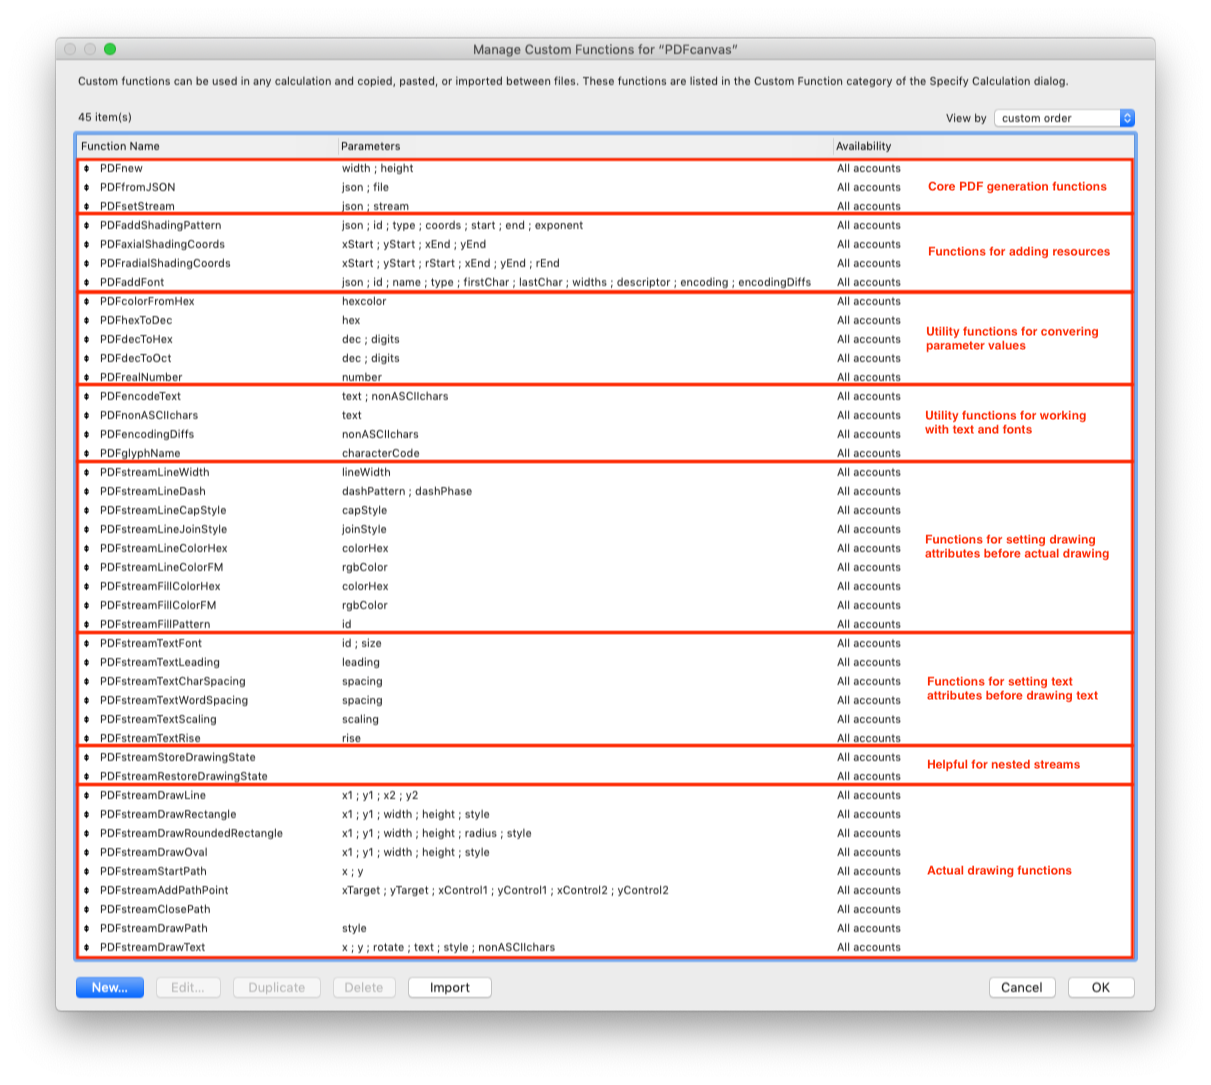
All the PDF generation in the example is handled solely by 42 custom functions. All fields, scripts and layout objects serve just as a user interface for you to try them out.
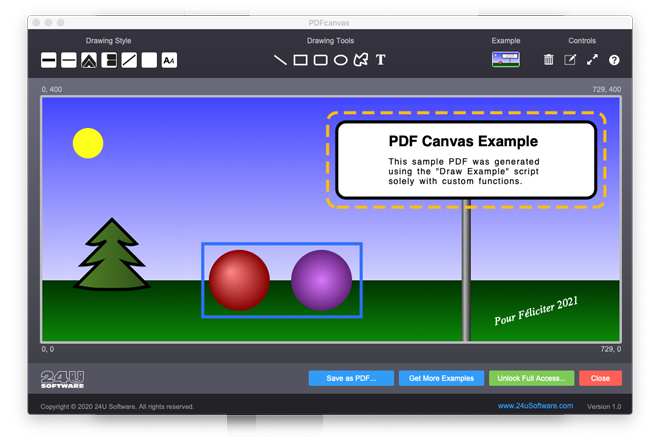
If you want to try the example out, the best way to start is to try to draw something using the user interface. That way you get an essence of what the custom functions can draw (lines, rectangles, ovals, custom shapes, text), what drawing parameters you can modify (stroke color, fill color, gradients, line width).
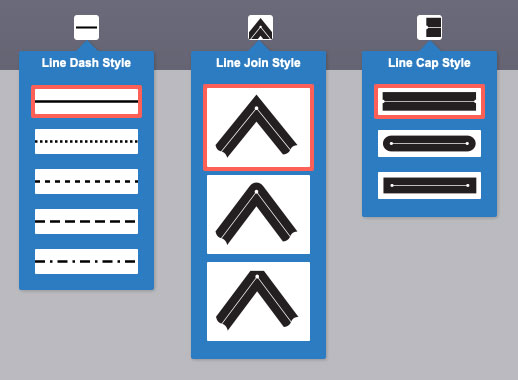
It’s good to know that PDF directly supports even line dash styles, three different way to join lines in an angle, and three different ways to end an unclosed line.
By default, PDF uses coordinate system starting in the bottom left corner of the page and the default units are points (1/72 of inch). Since FileMaker also uses points as its base measuring unit, it’s likely to be easy to work with for most FileMaker users. The only difficulty may be in the Y coordinate growing from bottom to top, while FileMaker layouts use the opposite direction. To help you stay oriented, the coordinates of each corner of the container field are displayed.
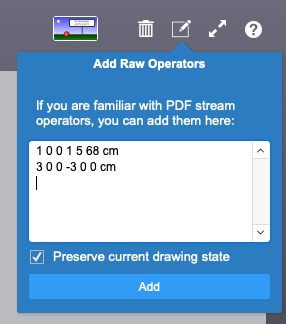
The PDF format supports coordinate system transformations, color spaces and other things, even 3D rendering. I did not provide specific functions or user interface for them to keep the example simple, but if you want to learn them from the PDF documentation and try them out, there is a way to enter raw stream operators as well.
Once you’re done playing with various drawing tools, you may also want to try the built-in sample script that demonstrates what can be easily produced with the custom functions:
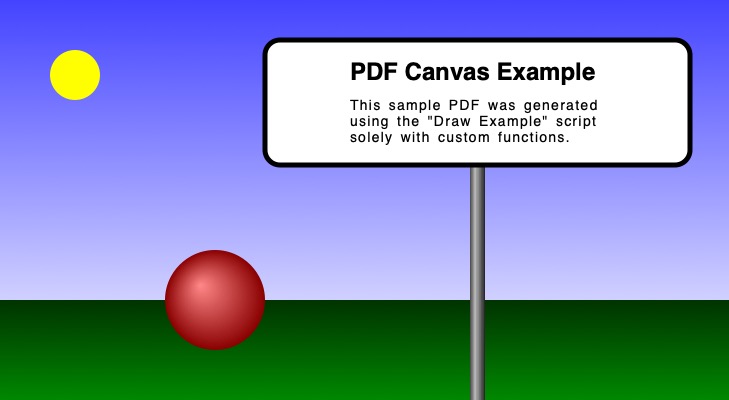
The easiest way to learn is from examples, so I suggest you then take a look at the Draw Example script to see how it’s done. The script first creates a new PDF JSON structure using the PDFnew custom function. It then builds up the content stream in a separate $stream variable, adding any necessary resources (font definitions and gradient patterns) to the JSON structure. Once the stream is complete, it is added to the JSON structure as well using the PDFsetStream function and the PDFfromJSON function is used to generate the final PDF document.
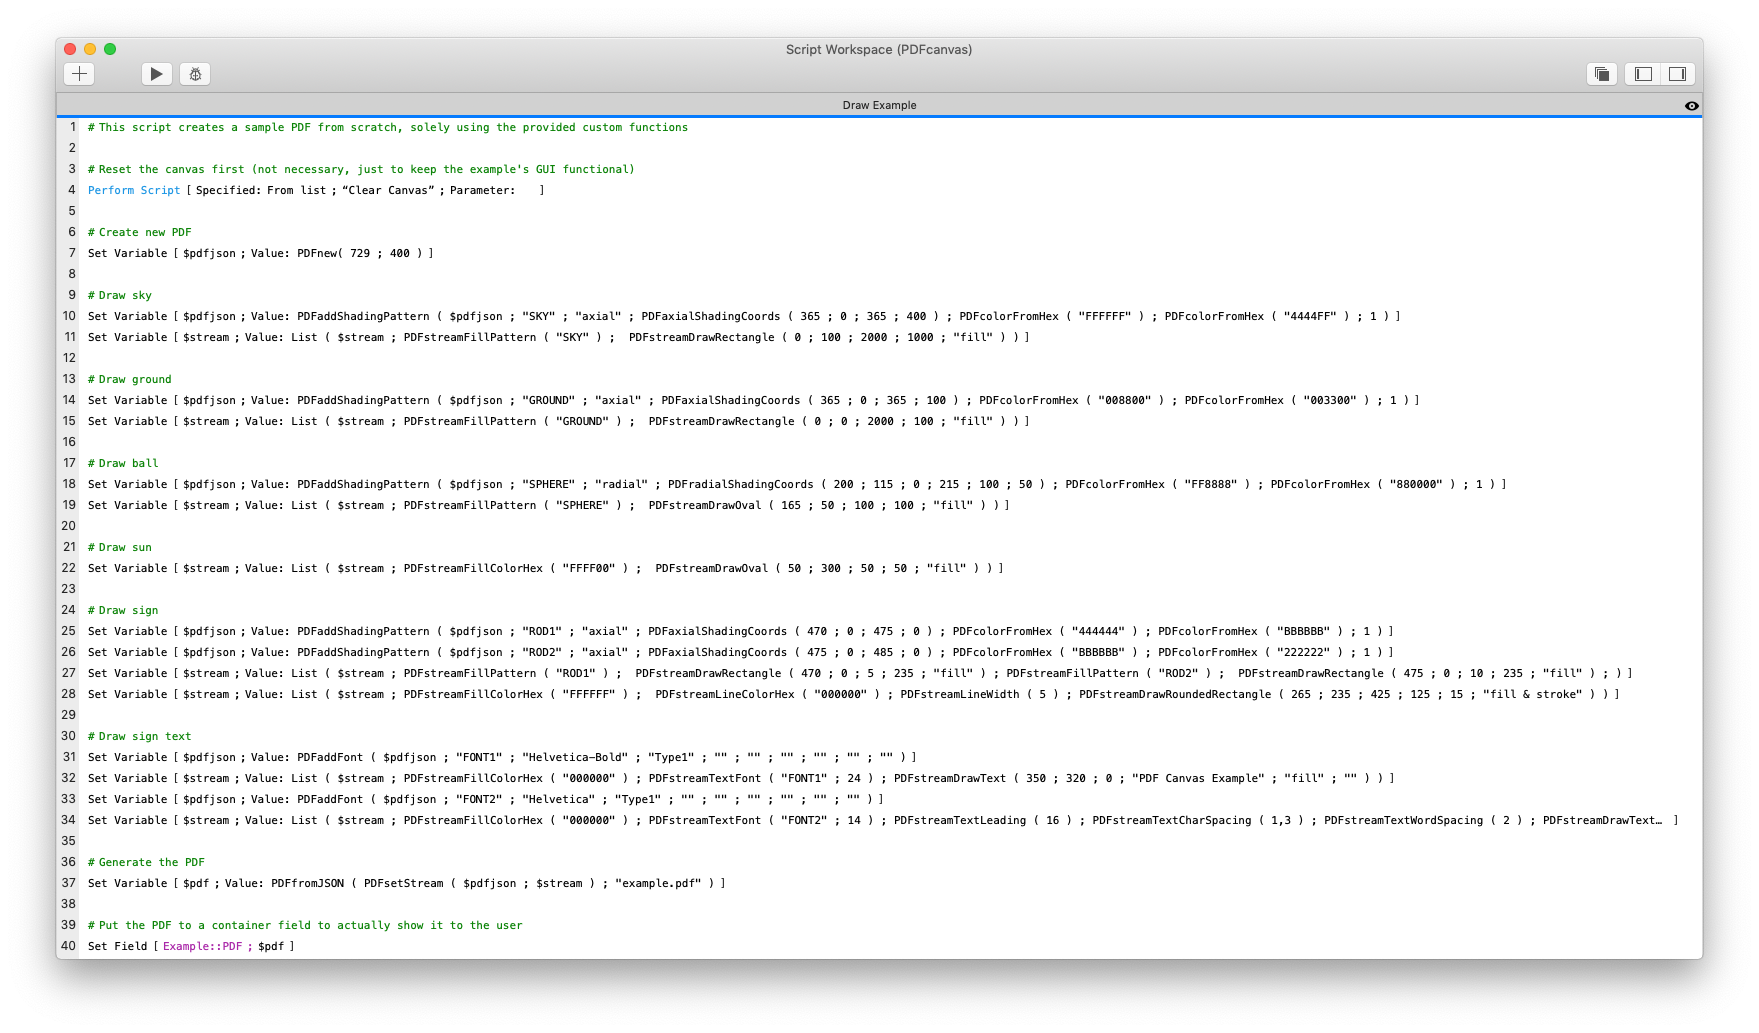
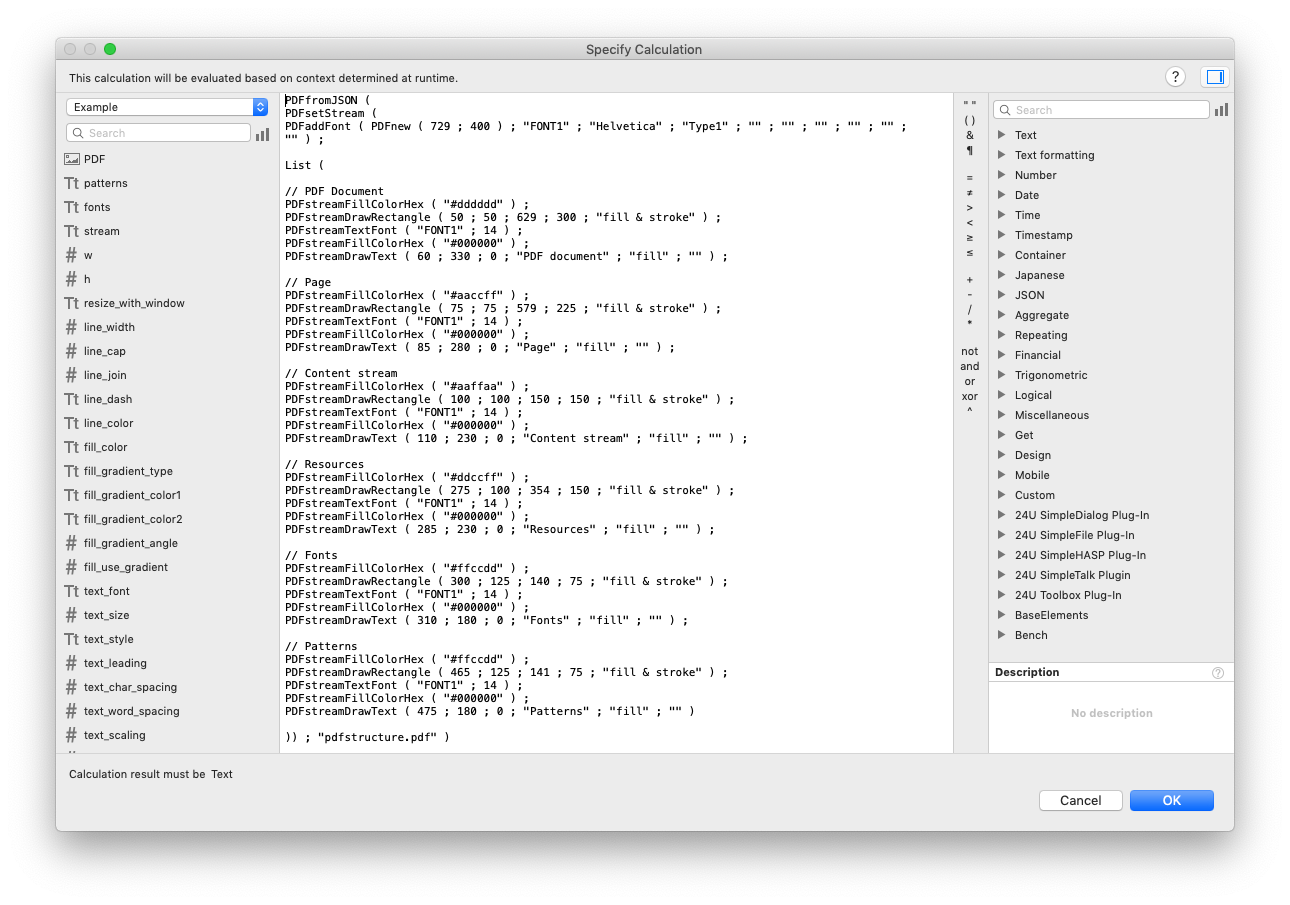
All the individual steps are created as separate script steps in the Draw Example script to make it easier to understand, but I could also do that in a single script step. For example, the picture used earlier in this article to explain a simple PDF structure was generated by another script in the example, using a single calculation:
You will soon discover that the custom functions are a lot longer than the content stream they generate, but using them makes the drawing code more readable and easier to understand.
Using it for your own apps
To generate PDF drawings in your own apps, you can just copy all the 42 custom functions (those whose name starts with “PDF”) and paste them to the FileMaker file where you want to use them. Alternatively, if you do not like to have so many custom functions there, you can use the example as a utility file and add scripts you can then call from your app.
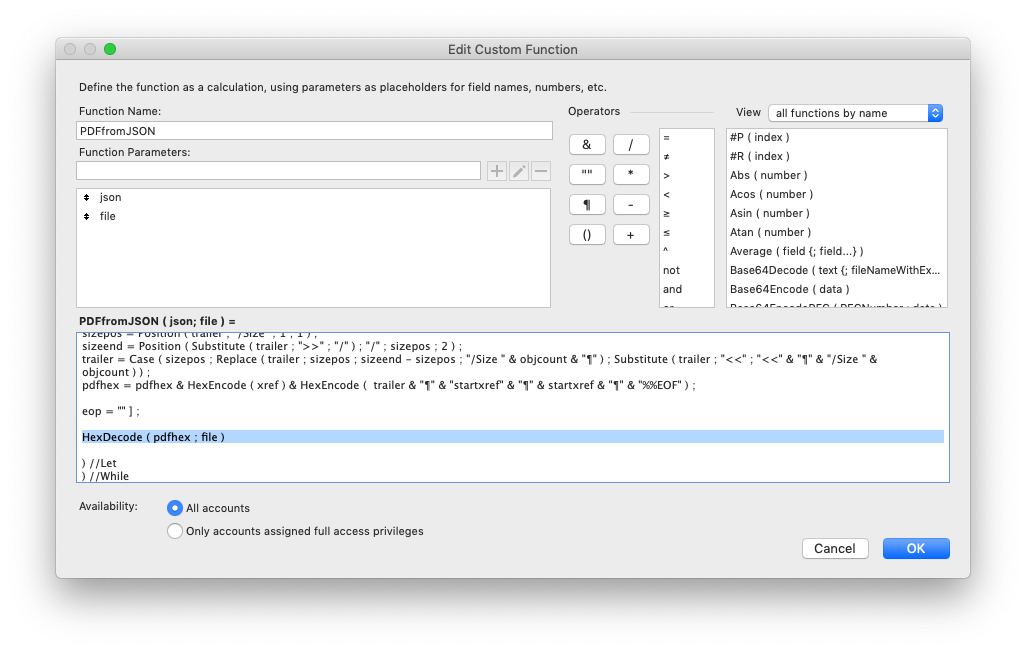
If you choose the utility file approach, just keep in mind that the Get(ScriptResult) function cannot return binary container data, so you may want to return the PDF JSON structure as result from your script and copy at least the PDFfromJSON function to your app to apply it there. Or you can modify the custom function to return the PDF hexadecimally encoded and do just the decoding in your app.
I am sure you will appreciate that these custom functions are 100% compatible with the whole FileMaker platform. You can use them in server-side scripts, in WebDirect, and even in FileMaker Go.
Practical use
You may already have a few ideas how to use this in your apps and projects. For the case you don’t, I have asked a few people for you and here are some ideas that might inspire you.
If you work with documents (and who does not?) you may find the drawing functions useful for highlighting some parts in them. Even though these custom functions are not ready to modify an existing PDF, they produce a transparent PDF by default, so you can overlay your custom-drawn PDF over the container holding your document, and use Save As PDF to create a combined one.
In manufacturing, you can find it very helpful to be able to preview the shape of a part CNC program is supposed to produce. In education, being able to draw lines and shapes by providing X, Y coordinates can be used for math and geometry.

Do you have another idea? Please let me know using the contact form below and I will be glad to update this article to list it here!