A customer specializing in the management and maintenance of industrial building infrastructure was looking for an effective way to connect their technical documentation with their database. The goal was to create a tool that would allow technicians to quickly identify specific equipment in building drawings, determine its location, and understand how it connects to various utility systems. The customer already had detailed DWG drawings and an equipment database, but lacked a tool that could visually and data-wise link this information together.
We developed an interactive tool that connects database records with technical building drawings. The DWG drawings were converted into SVG format using the specialized server-based converter QCAD, enabling them to be displayed directly within the FileMaker environment using the WebViewer. The SVG format within an HTML wrapper also allows for interactive operations with individual elements in the drawing (such as zooming and dynamic highlighting).
Each object in the drawing is linked to a specific record in the database. For example, from the equipment detail screen, a user can click a button to automatically navigate to the corresponding area in the drawing, zoom in, and highlight it. It also works the other way around – clicking on an element in the drawing opens the detailed equipment card in the system.
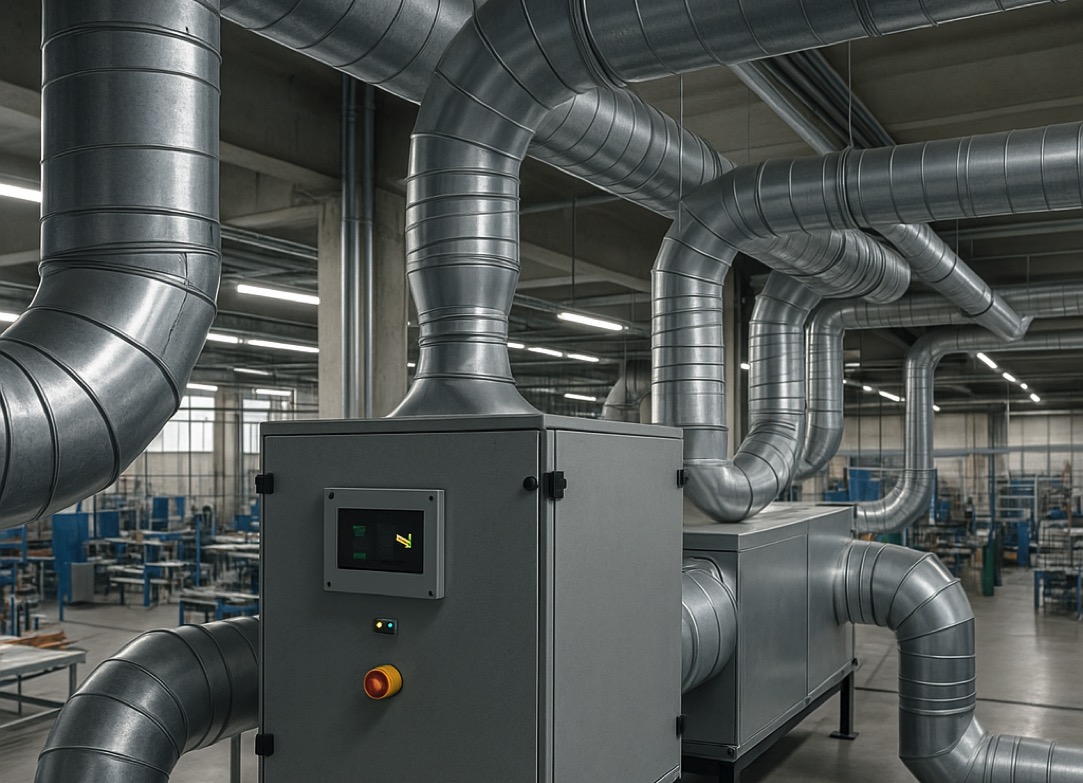
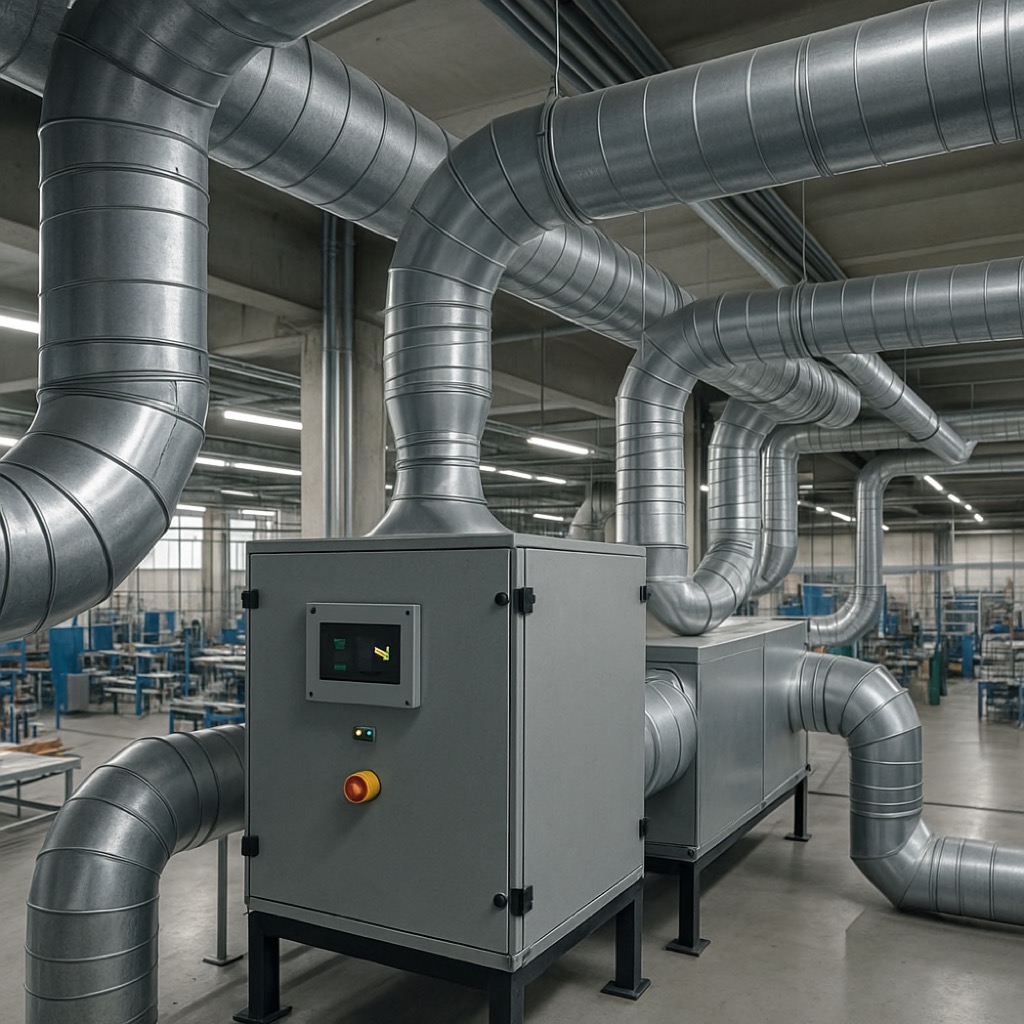
The drawings include not only the layout of rooms but also the routing of ventilation systems, electrical wiring, chemical pipelines, and other critical components. Among other things, our tool helps verify whether any configuration changes might impact the functionality of the entire network or larger infrastructure segments.

Adding a new drawing is simple through the user interface – the drawing is uploaded, automatically converted to SVG, and the system extracts all necessary elements (including their code labels), which are then linked to the database.