A customer operating factory equipment management software needed a clear way to visualize the interconnections between individual air-handling components — from fans and ducts to machines. They wanted to display operational values such as air pressure or flow within different infrastructure segments and evaluate how heavily each system branch was loaded. In addition, they required the ability to edit, add, and modify individual components directly within the schematic, which is far more intuitive than working with a database structure.
We designed a system that allows for interactive visualization of the entire air-handling network within FileMaker. The schematic is displayed in a WebViewer. By passing a URL with the identifier of a specific record, the system knows which data to load. A web server then uses the Data API to fetch the necessary information from the database and renders a complete visualization using web technologies.

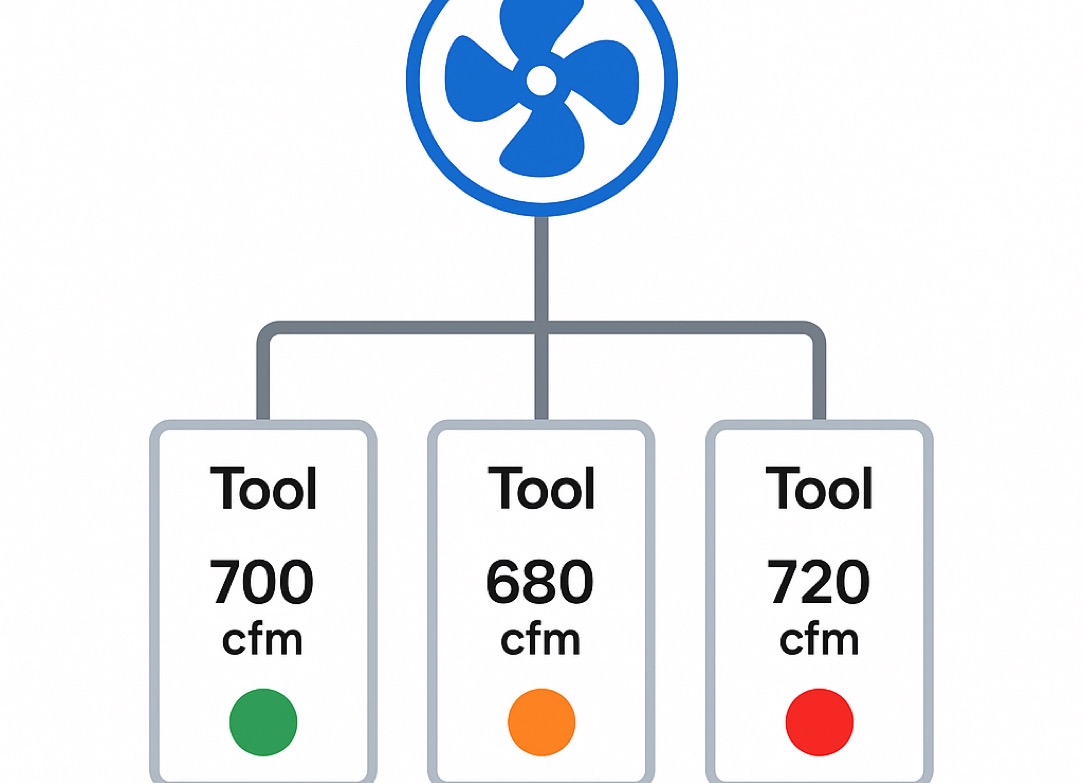
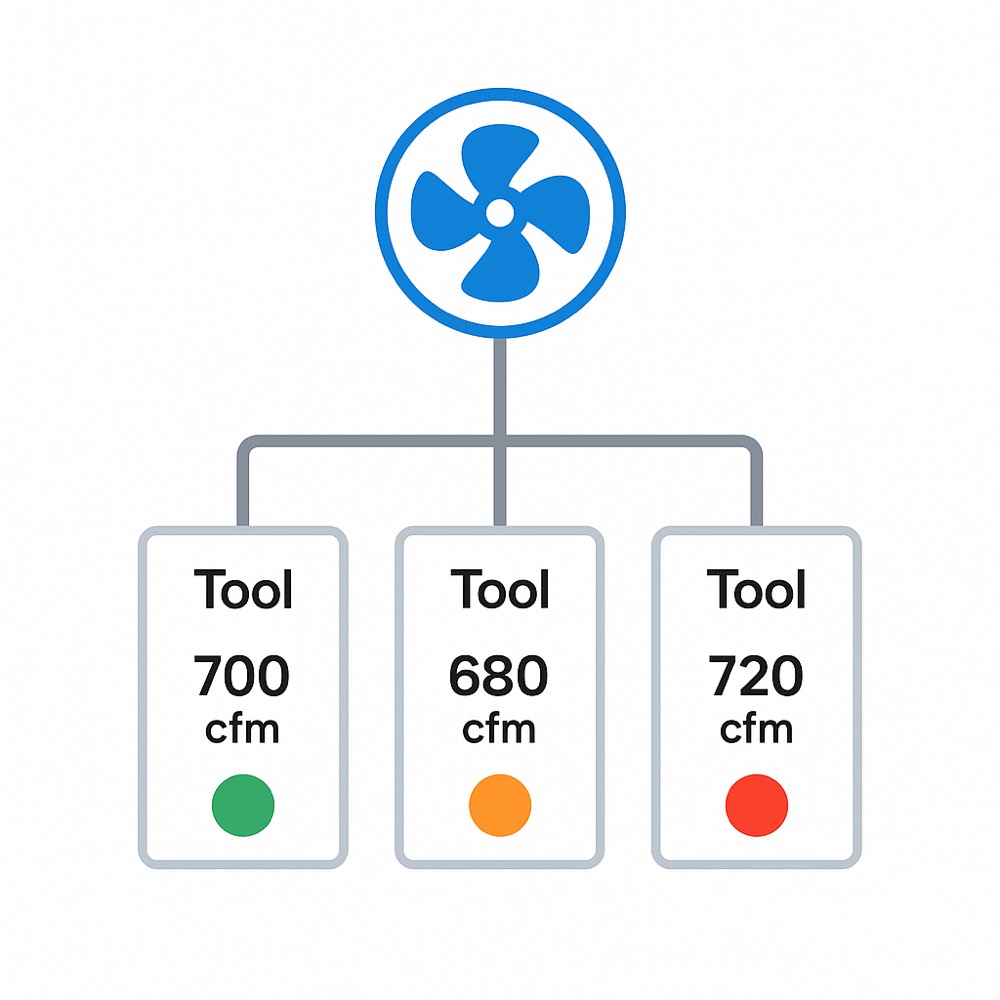
Users can create new branches, add various elements, and modify existing connections directly within the schematic. To help with quick navigation, we introduced visual indicators showing system load levels.
We ensured that user-entered data always produces a valid schema and prevents issues such as loops or incorrect hierarchies. We also implemented validation mechanisms and a reporting module that alerts users to any inconsistencies.